


Market Insight - December 2021
For better or worse, the U.S. and other global economies have been supported by ever increasing stimulus from central banks for over a decade. Under the directive to support full employment and stable inflation, the Federal Reserve - the U.S. central bank – (the “Fed”) has expanded its toolbox to provide unprecedented amounts of monetary stimulus. Predominantly, monetary stimulus has come in the form of supporting historically low interest rates and buying of investment securities in the market. The Fed maintained exceptionally accommodative policies over the past ten-plus years mostly because inflation and economic growth remained stubbornly low. In fact, perhaps worse than the relatively high inflation that has become a concern of late has been the prospect of deflation, something the Fed has desperately wanted to avoid.
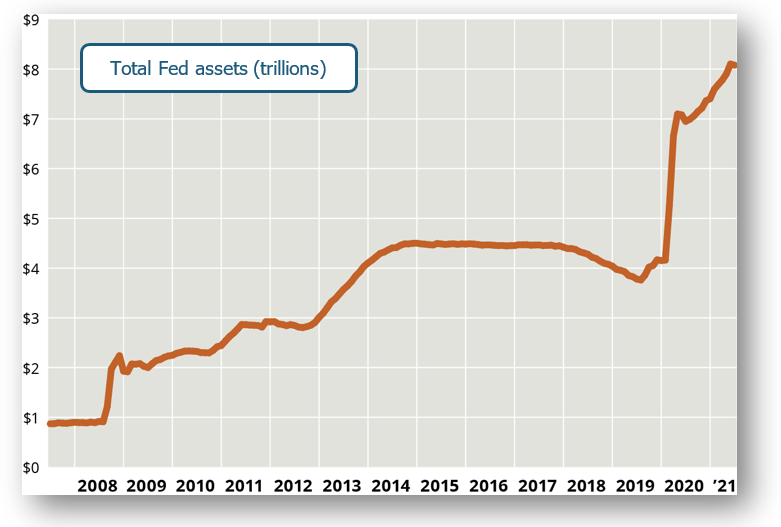
In its battle to avoid deflation and support full employment, primarily during recessions in 2008 and 2020, the Fed has now amassed over $8 trillion of assets in its account1. By purchasing securities, mostly bonds, the Fed has artificially increased demand and the price of bonds. As the price of a bond rises, its future return, or its yield, goes down. This strategy by the Fed has helped to support persistently low interest rates for over a decade and fueled a substantial bull market for investment assets like stocks and real estate, both of which were part of the Fed’s plan.
Chart 1
The Fed intended to nudge consumers to buy more with money borrowed at low interest rates and for companies to invest more by issuing debt with lower financing costs. The result would hopefully be stronger economic growth, which would help to lower unemployment and create inflation. While the strategy arguably worked to bring unemployment down, creating modest, stable inflation proved to be more of a challenge.
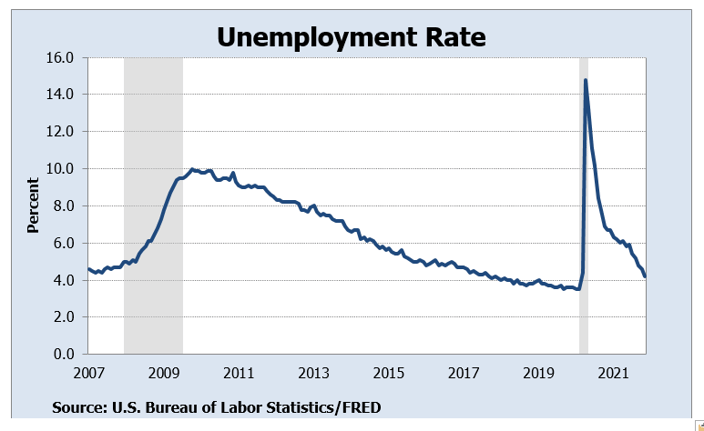
The U.S. employment picture showed steady improvement from 2009 all the way up until the pandemic hit in early 2020. The U.S. unemployment rate had dropped all the way to 3.5 percent in the months just prior to the 2020 recession. That was the lowest unemployment rate since 1969.
Chart 2
In 2019, just prior to a global pandemic, with the U.S. at or very near full employment, the Fed still had about $4 trillion of assets in its account. While not necessarily increasing stimulus, it wasn’t being too hasty about removing the support. A primary reason being that inflation in the U.S. wasn’t rising fast enough to justify the Fed acting too quickly. Additionally, unwinding the policies that led to lower unemployment, stronger economic growth and higher investment asset prices may well cause the opposite effect. What’s more is that the Fed did not want to risk inviting deflation, which theoretically may have resulted from removing stimulus too soon.
Why The Need for Inflation
Inflation, as measured by the Consumer Price Index (CPI), was rising at about 2.3 percent at the end of 20192. The Fed wants and the economy needs inflation. Stable, predictable, modest increases in prices for goods and services over time is beneficial to a growing economy. In general, it allows employers to budget effectively, workers to see regular wage increases, consumers to exhibit normal purchasing behavior, and instills a sense of rising living standards. These effects are supportive of a mature, growing economy.
The Fed has determined that an appropriate level of inflation is in the 2 to 3 percent range per year. Too much lower or higher than that starts to generate problems that jeopardize economic growth. In November, inflation ticked up to 6.8 percent, the highest year-over-year increase in prices since 19822. It also marked the seventh consecutive month of annual inflation of over 4 percent. As can be seen in Chart 1, the Fed has maintained over $8 trillion in assets it owns despite inflation running well over its target range for seven months. The Fed has communicated its willingness to have inflation run higher than its targeted range as it prioritizes support for economic recovery from the pandemic. In other words, the Fed hasn’t wanted to reduce the amount of assets in its account or raise interest rates too quickly, both actions that might help to temper inflation, as those actions may also stall the economic recovery.
stimulus changes to come
With unemployment at nearly 4 percent and projected economic growth for 2021 to be 5.5 percent3, justifying current levels of stimulus from the Fed is getting challenging, particularly with inflation at levels not seen in nearly forty years. Just recently, Fed Chair Jerome Powell acknowledged that the inflation pressures facing the U.S. may last longer than originally expected as new COVID variants extend the pandemic. Therefore, we would not be surprised to see the Fed move toward reducing the stimulus in the economy more quickly in 2022. The pace of these actions will likely hinge on a few notable factors.
The Fed knows that despite unemployment being about 4 percent, the jobs market remains significantly disrupted from COVID. Additionally, supply chain slowdowns have and may continue to impede spending in the economy, constraining growth below potential. While the prices of most types of investment assets (e.g. stocks, real estate, bonds, etc.) have risen as the Fed has increased economic stimulus, the Fed is likely to seek a balance between reducing stimulus to counter inflation and not overreacting to the point of setting back the economic recovery and unsettling the capital markets. Threading the needle on this won’t be easy, but the Fed has proven its ability to steer the ship skillfully when faced with similar challenges in the past.
Inflation's affect on Stocks and Bonds
Recently, we’ve seen elevated levels of concern regarding inflation and how it may affect portfolios. Unquestionably, inflation has permeated everyone’s life and so it’s natural to expect there to be some angst regarding the affect it may have on investments. To be clear, there are no absolutes when discussing risk in investment portfolios. Inflation hasn’t increased in a vacuum, rather it’s been occurring while a pandemic has caused global disruption in trade. Many other factors will influence the capital markets aside from inflation, so addressing rising prices in a portfolio comes with trade-offs that require consideration. For the purposes of this letter though, we’ll stick to simply considering inflation pressures.
Research from The Leuthold Group4 shows that high levels of inflation don’t necessarily spell trouble for stock market investments. Arguably, inflation is peaking right now. Leuthold looked back at the thirteen highest inflation spikes in the U.S. since 1950 and calculated that the average stock market return in the twelve months following the spike was 13.2 percent.
Inflation can have a more detrimental effect on the value of bonds though. Bonds are like IOUs. The value of a bond is generally based on the amount of interest that the borrower pays the lender and the perceived risk of the borrower not ultimately paying the lender back. Inflation can cause interest rates to rise. As interest rates rise, the value of older bonds that are paying comparatively lower rates of interest typically falls as investors demand the newer, higher interest-paying bonds.
As you can imagine though, all bonds are not equal and the value of some types of bonds are more susceptible to rising interest rates. Take Bond A that will mature in six-months compared to Bond B that will mature in six-years. The value of Bond A will likely change less than Bond B in a rising interest rate scenario because when Bond A matures in six-months, the owner of the bond will be able to reinvest the entire investment in a higher interest-paying bond. The owner of Bond B has to wait six more years with a comparatively lower interest-paying investment, so that bond will likely fall in value more than Bond A in this scenario. Of course, if interest rates were to go down though, we would expect the value of Bond B to increase more than the value of Bond A.
Inflation, as measured by the CPI, has gone from zero in May 2020 to nearly 7 percent in November 20212. Over that same period, the interest rate on 10-year U.S. Treasury Notes has doubled from 0.7 percent to 1.4 percent5. So, how have bond investments fared during that same period of rising interest rates? Based on the broad Bloomberg US Aggregate Bond Index, bonds have eked out a marginal 0.6 percent cumulative gain6. The S&P 500® Index of U.S. stocks is up over 50 percent since May of last year6. Despite a significant increase in inflation over the past year and a half, bond and stock investors have generally seen their portfolio values rise during that time.
Investing for the Long-term
We haven’t seen inflation readings like we’re currently experiencing for decades, but that doesn’t mean that a shift in your long-term investment strategy is warranted. Inflation doesn’t occur in a vacuum. Other factors must be considered. We have built the bond portion of portfolios with the expectation that interest rates are likely to remain relatively low for a prolonged period of time, but that they may bounce around as central banks vacillate between adding and removing stimulus. Additionally, it is important to remember that bonds play a vital diversification role in portfolios. Portfolio changes made to protect bond investments from inflation or higher interest rates generally will also reduce the portfolio diversification that bonds provide should the stock market fall in value. We will continue to assess the impact of higher prices on the economy, corporate earnings, and interest rates. At this time though, we believe that portfolios are well-positioned for the long-term and are properly diversified for the unpredictable short-term.
Table 1
| Market Indices (As Of 11/30/21) | Three Months | One Year |
| Dow Jones Industrial Average | -2.1% | +18.5% |
| NASDAQ Composite | +2.0% | +28.2% |
| S&P 500 Index | +1.3% | +27.9% |
| Bloomberg Barclays Capital Aggregate Bond Index | -0.6% | -1.2% |
| Small Cap Stock (Russell 2000 Index) | -3.0% | +22.0% |
| Non-US Stock (MSCI EAFE Index) | -5.1% | +10.8% |
In the season of giving thanks and expressing gratitude, we want to let you know that we feel so blessed to be in your life. Thank you for choosing to work with us and for the friendship that have developed over the years. We wish you a holiday season filled with love, family and friends and a healthy, prosperous, and peace-filled 2022.
Gratefully yours,
Steve Dixon, CFA CSRICTM
Investment Manager
Dana Brewer, CFP®, Bridget Handke, CFP®, Damian Winther, CFP® CSRICTM, Rachel Infante, CFP® CSRICTM, Kimmie Moehring, CFP®
Sources
1 Source: Board of Governors of the Federal Reserve System (US), Assets: Total Assets: Total Assets (Less Eliminations from Consolidation): Wednesday Level [WALCL], retrieved from FRED, Federal Reserve Bank of St. Louis; https://fred.stlouisfed.org/series/WALCL, December 5, 2021.
2 Source: U.S. Bureau of Labor Statistics, Consumer Price Index for All Urban Consumers: All Items in U.S. City Average [CPIAUCSL], retrieved from FRED, Federal Reserve Bank of St. Louis; https://fred.stlouisfed.org/series/CPIAUCSL, December 14, 2021.
3 Source: “The Conference Board Economic Forecast for the US Economy.” Economic Forecast for the U.S. Economy, The Conference Board, 10 Nov. 2021, https://www.conference-board.org/research/us-forecast.
4 Source: Paulson, James. A Few Comforting Reminders. The Leuthold Group, 14 Dec. 2021, https://advisors.leutholdgroup.com/research/paulsen/2021/12/14/a-few-comforting-reminders.23332.
5 Source: Board of Governors of the Federal Reserve System (US), Market Yield on U.S. Treasury Securities at 10-Year Constant Maturity [DGS10], retrieved from FRED, Federal Reserve Bank of St. Louis; https://fred.stlouisfed.org/series/DGS10, December 16, 2021.
6 Source: Morningstar Direct.
Chart 1 Source: Rothman, Larry. “Graphic: A Look at the Fed's Balance Sheet.” Pensions & Investments, 12 July 2021, https://www.pionline.com/interactive/graphic-look-feds-balance-sheet.
Chart 2 Source: U.S. Bureau of Labor Statistics, Unemployment Rate [UNRATE], retrieved from FRED, Federal Reserve Bank of St. Louis; https://fred.stlouisfed.org/series/UNRATE, December 15, 2021.
Table 1 Source: Morningstar. Market indexes are unmanaged, and investors cannot invest directly in indexes. However, these indexes are accurate reflections of the performance of the individual asset classes shown. All returns reflect past performance and should not be considered indicative of future results.

Investment advisory services offered through Birchwood Financial Partners, Inc. an SEC Registered Investment Advisor.
Opinions expressed are not intended as investment advice or to predict future performance. No independent analysis has been performed. Investment decisions should not be based on information in this letter since the information contained here is a singular update, and prudent investment decisions require the analysis of a much broader collection of facts and context. All information is believed to be from reliable sources, however we make no representation as to its completeness or accuracy. All economic and performance information is historical and not indicative of future results. Asset allocation, which is driven by complex mathematical models, should not be confused with the much simpler concept of diversification. Asset allocation cannot eliminate the risk of fluctuating prices and uncertain returns. Rebalancing may be a taxable event. Before taking any specific action, be sure to consult your tax professional.
