 Market Insight - August 2018
The global economy is built on expectations. Understanding and evaluating different potential outcomes underlie how we make economic decisions. Confidence in our decisions depends on our perception of the ability to see clearly into the future. That fact was displayed in late-July when Facebook announced that it fell short of expectations for revenues during the most recent quarter. The company missed expectations by about $130 million, reporting quarterly revenues of $13.2 billion. Furthermore, the company tempered future expectations by commenting that revenue growth will likely slow for the rest of the year1. This sudden change in expectations led Facebook to suffer the largest one-day loss in value for a U.S. company in history, about $119 billion2.
Expectations are changing on a continual basis in our global economy. When expectations improve it can be reflected in more confident consumer behavior which leads to a self-fulfilling prophecy. If you feel more confident about your economic future, you’re more likely to spend more of your current income and save less. If expectations worsen, it’s natural to expect more cautious, austere consumer behavior. At a very broad level, recent rhetoric and actions to increase tariffs on imported goods to the U.S. has been interpreted as a negative change in expectations, resulting in less clarity and more caution for consumers and businesses. A tariff is a tax on imported goods. Unexpected increases to the cost of certain imported goods have led to significant declines in the value of stocks like Harley-Davidson and commodities like soybeans.
The Evolution of U.S. Trade and Tariffs
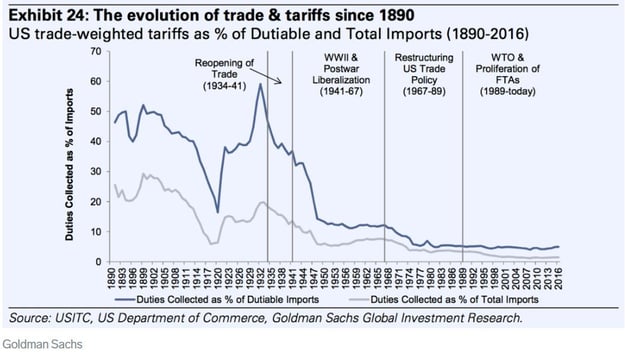
U.S. trade policy has evolved dramatically since its founding. Beginning in the 18th century as a way to generate revenue for a new U.S. government and to foster the growth of domestic industry, tariffs on imported goods have fluctuated from over 60 percent in the late-1820s3 to under 2 percent in 20164. Average tariff rates on imports remained in the double-digits until the early 20th century when a more industrialized U.S. found that the benefits of freer trade began to outweigh the revenue generated from taxing imports. Tariffs spiked again during the 1920s, peaking with the infamous Smoot-Hawley tariff of 1930 that economists highlight as a contributing factor to the severity of the Great Depression. Intended to protect U.S. industry from foreign competition in a time where the economy was under considerable strain the tariffs only served to impede progress toward a recovery.

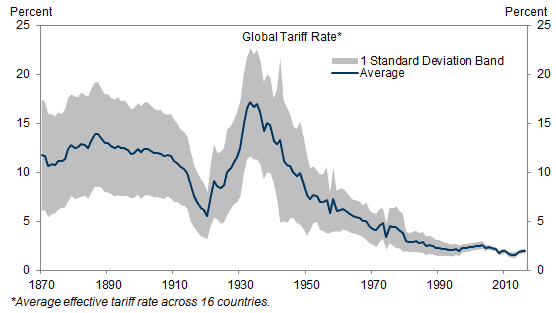
Following World War II, the adoption of the General Agreement on Tariffs and Trade in 1947 and the subsequent formation of the World Trade Organization (WTO) in 1995 served to reduce global tariffs dramatically. With 164 members, the WTO nations represent 98 percent of global trade5. Progress toward free-trade has contributed to opening borders and contributed to an increase in prosperity.
Graph 2

In January, the U.S. imposed tariffs on solar panels and washing machines, setting off what the media is calling a “trade war”. In June, President Trump announced that the U.S. would impose a 10 percent tariff on $200 billion worth of Chinese imported products ranging from computer components to refrigerators to plastics. The proposed tariff was later increased to 25 percent. The president also vowed to increase the amount of imported goods subject to tariffs to $400 billion if China retaliated with higher tariffs on U.S. goods. While none of these additional tariffs are likely to be implemented until later this year if at all, expectations are changing.
Our North American neighbors have also been in the president’s crosshairs, as has Europe. China, Canada, Mexico and the European Union have all retaliated against U.S. tariffs by increasing the cost of certain goods exported from the U.S. While it seems that the ultimate target of President Trump’s focus on renegotiating trade is China, the cost of imported and exported goods has been rising. This has forced some businesses to get creative to salvage profit margins by moving production overseas, changing suppliers and passing on higher prices to consumers.
Historically, evidence suggests that increasing the cost of trade is ultimately detrimental to economic growth for both the importer and the exporter, albeit not substantially. Research by Goldman Sachs finds that economic growth has tended to fall by about 0.2 percent on average following a 1.5 percent increase in trade costs6. Given the size of tariffs being proposed on Chinese exports to the U.S., we should expect the impact on U.S. and Chinese economic growth to be more pronounced.
The president’s goal has been to create more balance between the U.S. and its major trading partners, but specifically China. Annually, the U.S. has a trade deficit with China in excess of $300 billion. In 2017, the U.S. imported $505 billion worth of goods from China and exported only $130 billion7. Additionally, China has used practices such as requiring that U.S. companies enter into a joint venture with a Chinese company in order to do business in China. In some cases, these joint ventures have served to create an opportunity for the transfer of intellectual property from the U.S. company to the Chinese company. In other cases, Chinese companies are supported or subsidized by the government, creating what many argue is an unfair advantage when competing with foreign companies.
As the capital markets react to news of progress in renegotiating trade deals between the U.S. and its major trading partners, it’s easy to see expectations changing. The U.S. stock market lost value during the second half of June as trade threats between the U.S. and China intensified. Europe and Mexico have since sought to engage with the U.S. to discuss trade agreements and the stock market has moved higher.
Importance of Portfolio Diversification
Investing in an environment where expectations are changing quickly and unpredictably is not unusual. In fact, it is one of the primary reasons we strive to maintain an appropriate level of diversification in your portfolio. While the base case appears to be that a full-blown trade war is unlikely, the markets will continually adjust to changes in the potential outcome of renegotiating trade agreements. As we near mid-term elections in the U.S., we further expect that the president will seek to claim as many victories as possible. Maintaining a strong U.S. economy and a healthy U.S. stock market would certainly be high on that list. As such, we continue to monitor the progress of trade renegotiations, but do not expect that the trade war will intensify to a point where it derails the global economy. We promote diversification in your investment portfolio because we know that expectations can change abruptly. We believe that your portfolio remains in a position to fulfill your long-term goals and would not recommend deviating from that strategy.
Table 1
|
Market Indices (as of 06/30/18) |
2nd Quarter |
One Year |
|
Dow Jones Industrial Average |
+1.3% |
+16.3% |
|
NASDAQ Composite |
+6.6% |
+23.6% |
|
S&P 500 Index |
+3.4% |
+14.4% |
|
Barclays Capital Aggregate Bond Index |
-0.2% |
-0.4% |
|
Small Cap Stock (Russell 2000 Index) |
+7.8% |
+17.6% |
|
Non-US Stock (MSCI EAFE Index) |
-1.2% |
+6.8% |
We look forward to seeing you at our newly remodeled offices. After seven years at our current location it was time to spruce up the space. Thanks to some wonderful guidance from our designer and the aesthetic aptitude of Dana and Bridget we are excited to share our new look with you. Thank you sincerely for the continued referrals of your family, friends, neighbors and colleagues. We are so grateful that many of you have introduced us to someone that could benefit from our services. We continue to welcome that opportunity.


Gratefully yours, Steve Dixon, CFA®, Investment Manager
Kay Kramer, CFP®, Dana Brewer, CFP®, Bridget Handke, CFP®, Damian Winther, CFP®, Stacey Nelson, CFP®
Financial Advisors
Download Market Insight - August 2018 (PDF)
1. Source: Seetharaman, Deepa. “Facebook Shares Tumble as Growth Outlook Darkens.” The Wall Street Journal. July 25, 2018. https://www.wsj.com/articles/facebook-revenue-falls-short-of-expectations-1532549650. Accessed on July 30, 2018.
2. Source: Imbert, Fred and Francolla, Gina. “Facebook’s $100 billion-plus rout is the biggest loss in stock market history.” CNBC. July 26, 2018. https://www.cnbc.com/2018/07/26/facebook-on-pace-for-biggest-one-day-loss-in-value-for-any-company-sin.html. Accessed on July 30, 2018.
3. Source: Irwin, Douglas A. “Historical Aspects of U.S. Trade Policy.” National Bureau of Economic Research. Summer, 2016. http://www.nber.org/reporter/summer06/irwin.html. Accessed on July 25, 2018.
4. Source: “U.S. imports for consumption, duties collected, and ratio of duties to value, 1891-2016.” U.S. International Trade Commission. March, 2017. https://www.usitc.gov/documents/dataweb/ave_table_1891_2016.pdf. Accessed on July 31, 2018.
5. Source: https://www.wto.org. Accessed July 30, 2018.
6. Source: Stehn, Sven Jari. “The Cost of Trade Wars. Let the Data Speak.” Goldman Sachs. July 25, 2018.
7. Source: https://www.census.gov/foreign-trade/balance/c5700.html. Accessed July 30, 2018.
Chart 1 Source: USITC, US Department of Commerce, Goldman Sachs Global Investment Research.
Chart 2 Source: Clemens and Williamson (2002), World Bank, Goldman Sachs Investment Research.
Chart 3 Source: U.S. Department of the Treasury. Daily yields were downloaded from the Federal Reserve Bank of St. Louis on May 1, 2018. Difference calculation performed by Birchwood Financial Partners.
Table 1 Source: Morningstar. Market indexes are unmanaged and investors cannot invest directly in indexes. However, these indexes are accurate reflections of the performance of the individual asset classes shown. All returns reflect past performance and should not be considered indicative of future results.


