
Market Insight - July 2016
I’ve always had a fascination with the night sky, watching the stars and learning to identify planets and constellations. I remember “camping” in a friend’s backyard when I was young and watching the northern lights, back when they were still visible from Minnetonka. Last fall, I got a rare treat on my way in to the office as I caught a glimpse of a spectacular green meteor streaking through the early dawn sky. It’s difficult to not be in awe of the rarity of what we have on Earth when gazing into the infinite darkness of the night sky. Still yet, to realize that the earliest civilizations of humans have been staring up at the same scattering of brightly twinkling stars for over 5,000 years allows us to briefly relate to our ancient ancestors.
5,000 Year Interest Rate History
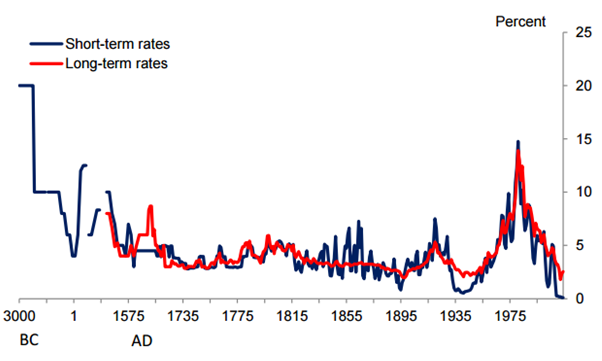
When I heard an analyst on a conference call state that we are experiencing the lowest global interest rates in our 5,000 year known history, I thought they were being facetious. Even if it were true, who has kept track of something like that? So, I looked it up and with an impressive list of references, Michael Hartnett from Bank of America Merrill Lynch produced the following two graphs showing interest rates dating back to 3000 B.C. and a more current retrospective of U.S. interest rates back to the first issuance of government debt in America following the American Revolution.Graph 1

Graph 2

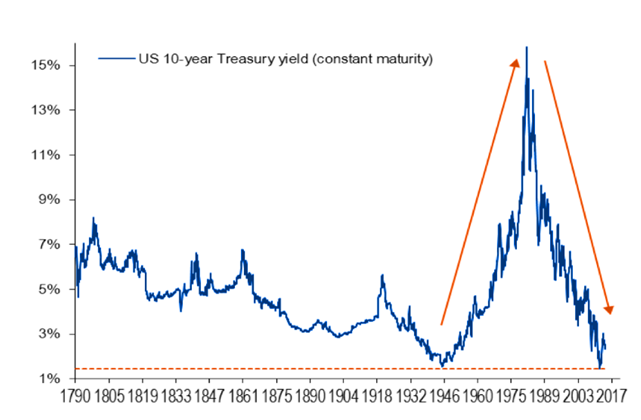
Neither graph is updated through early July of this year when the 10-year U.S. Treasury Note sank to a fresh all-time low yield of 1.32 percent1. The interest rate environment that we are experiencing is not only historic in terms of how low average yields are, but also on the expanse of the contagion. The global capital markets are now flush with nearly $13 trillion worth of negative yielding debt2. That’s a staggering one-third of the entire global bond market that offers investors the opportunity to pay someone to hold their money. In fact, nearly 75 percent of the global bond markets has a yield of of less than 1 percent3. What’s even more staggering is that the negative yields are extending out to bonds that won’t mature for five, ten, twenty or even fifty years! Earlier this month, Swiss 50-year bonds dropped to a slight negative yield4.
Understanding bonds can admittedly be confusing. We often talk about bonds in terms of what the yield is if we hold the note until it is repaid by the issuer. After all, a bond is simply a loan from the investor to the issuer with the promise of repayment of principal and interest at an agreed upon later date. The expected return on that investment, assuming the debt is repaid at maturity along with interest, is the yield. Where it gets complicated is when market interest rates change after an investor has already loaned money to a debt issuer and is now a bondholder. If market interest rates fall, as they have, it makes the investor’s bond more attractive since it will have a higher interest rate than other investors can get on a similar bond at today’s lower market rates. So the investor may choose to sell the bond to another investor and capture a quick gain instead of waiting for the bond to mature several years from now. So as market interest rates fall, it makes outstanding bonds more expensive.
The Relationship Between Bond and Yields
It’s the inverse relationship between the price of a bond and its yield that can be confusing. So another way of saying that interest rates are the lowest that they’ve been in 5,000 years is to say that bonds are more expensive than they’ve been in our known history. A concept that should give the rational investor pause as you contemplate what global economic conditions must persist for someone to agree to lend money with the near certainty of not getting their full investment back. Certainly these must be frightful economic times as investors flock to the safety of bonds. Of course we all know that isn’t the case.
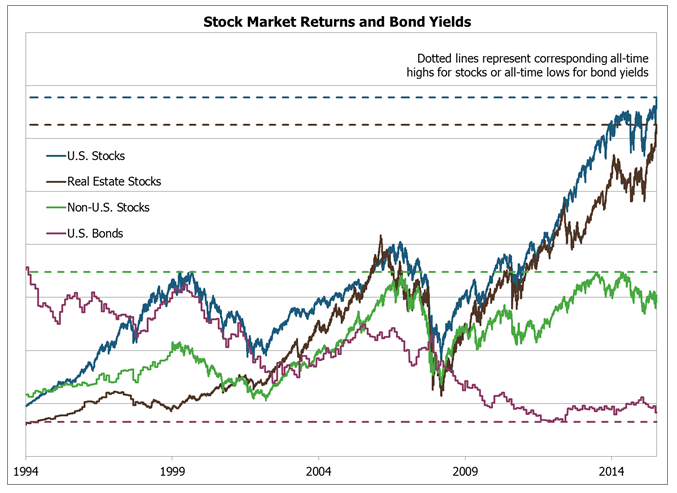
Shortly after U.S. bond yields touched a new all-time low, U.S. stocks set a new all-time high, eclipsing the 2134 level reached in May of last year5. As Graph 3 illustrates, it isn’t common for both stocks to rally to record highs and bond yields to reach record lows at the same time. The bull markets of the 1990’s and mid-2000’s corresponded with rising yields, in crude terms implying that investors sold bonds to buy more stocks. Conversely, in the bear markets of the early 2000’s and in 2008-2009, bond yields sank as investors left stocks for the safety of bonds.
Graph 3

Bonds vs. Stocks
The current state of the capital markets is perplexing and may be leaving many investors susceptible to being complacent in their investment strategy. After all, why change anything when your stocks and bonds are doing so well. Stock investors are following momentum and executing on the TINA principle (“There Is No Alternative”). They are also accustomed to short periods of stocks selling off, followed by sharp recoveries fueled by a continuation of central bank’s stimulative policy. Bond investors aren’t buying into the continuation of a bull market for stocks and are perhaps seeing weakening global economic growth on the horizon. Both are unlikely to continue to be rewarded for their outlooks.
Stocks and Bonds: What is the Best Indicator of the Economy?
Traditionally it is said that the bond market tends to be a good future indicator of what’s to come for the economy. With such pervasive intervention from governments in the global bond markets, that maxim may not be as reliable as it used to be. Are yields low because investors are cautious or because they expect more intervention from governments to drive yields even lower? Both explanations are likely the case.
Our approach to investing depends to a certain extent on reliable diversification characteristics of different types of assets. For instance, we expect that high-quality bonds will perform relatively better than stocks during a stock market sell-off. This relationship remains largely intact as we witnessed during the first six weeks of this year and most recently in the aftermath of the surprising referendum results in the U.K. While the relationship holds, the ability of bonds to offset poor stock returns is very likely compromised when bond yields fall to such low levels. This is what concerns us and why we spend so much time talking about volatility and our expectation for heightened volatility. We still believe that diversification is critical to achieving long-term investment goals, but we are very aware of the possible limitations to its effectiveness in the current market environment. We continue to seek the best combination of assets for portfolios based on the specific objectives of our clients.
Table 1

You may have been expecting an in-depth discussion on the investment implications of the U.K. referendum results in late-June that will lead to the first country extricating itself from the European Union in its history. This will be an ongoing topic and will undoubtedly come up in future letters. The truth is that the results of the vote were a surprise to us, but they don’t change our outlook for greater Europe. We have always held non-U.S. stocks in client portfolios, but reduced the allocation several years ago on the grounds that the economic situations in Europe and Japan were unsustainable. Europe unified with the intent of revitalizing economic growth and establishing long-lasting peace. The introduction of the euro currency further unified countries in the Eurozone. What became apparent following the financial crisis of 2008 was that this unification had shielded weaker economies in Europe from greater scrutiny by investors. With the veil lifted, certain countries in Europe came under extreme pressure as investment flowed out to stronger economies. Furthermore, the structure of the European Union wasn’t such that it could truly assist these weaker economies. While we see opportunity in Europe, we are quite concerned with the stability of the region and the effect that can have on investment results.
U.K. voters expressed a belief that they would be better off separate from unified Europe. Only time will tell if that is in fact the case. It doesn’t change our opinion that investment in Europe still is attractive, but comes with a higher degree of risk. The potential implications of the U.K. decision are greatly varied and if our opinion of the prospects in Europe should change we will certainly express that in investment portfolios and communicate it to you.
We are truly grateful for your continued trust in Birchwood and want to thank you for allowing us participate in your lives. As always, reach out to us anytime if we can be of service. Of course feel free to continue to provide feedback regarding these quarterly letters, it is always appreciated.
Download Market Insight - July 2016 (PDF)
1 Source: Marketwatch.com www.marketwatch.com/investing/bond/tmubmusd10y/historical?CountryCode=bx
2 Source: The Wall Street Journal “Black Hole of Negative Rates Is Dragging Down Yields Everywhere” published July 10, 2016 www.wsj.com/articles/black-hole-of-negative-rates-is-dragging-down-yield...
3 Source: J.P. Morgan 3Q2016 U.S. Guide to the Markets and BofA Merrill Lynch
4 Source: Financial Times “Swiss bond yields now negative out to 50 years” published July 5, 2016 next.ft.com/content/2ae4237a-2d3e-33dd-b9e0-120c4a93a29c
5 Source: Yahoo! Finance finance.yahoo.com/quote/%5EGSPC/history
Graph 1
Source: Bank of England Speech “Growing, Fast and Slow” given by Andrew G Haldane, February 17, 2015.
http://www.bankofengland.co.uk/publications/Documents/speeches/2015/spee...
Graph 2
Source: BofA Merrill Lynch Global Investment Strategy, Global Financial Data, Bloomberg.
http://www.businessinsider.com/10-year-us-treasury-note-yield-since-1790...
Graph 3
Source: Morningstar
U.S. Stocks are represented by the cumulative total return of the S&P 500 Index.
Non-U.S. Stocks are represented by the cumulative total return of the MSCI EAFE Index.
Real Estate Stocks are represented by the cumulative total return of the FTSE NAREIT Index.
U.S. Bonds are represented by the average yield of the Barclays US Government/Credit Index.
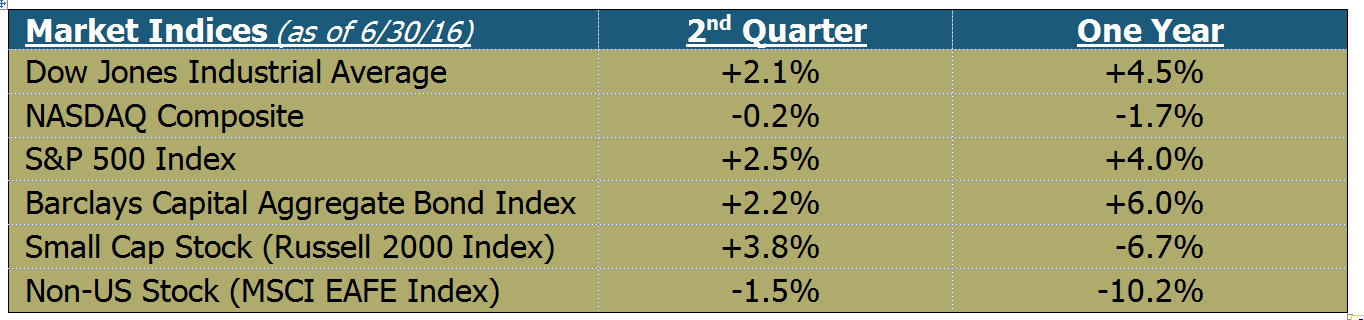
Table 1
Source: Morningstar. Market indexes are unmanaged and investors cannot invest directly in indexes. However, these indexes are accurate reflections of the performance of the individual asset classes shown. All returns reflect past performance and should not be considered indicative of future results.