


Market Insight - December 2022
Headlines are trending away from inflation as the primary concern of investors toward the threat of an economic recession next year. When you read those headlines, it’s important to remember that the capital markets are constantly fluctuating based on collective expectations for the future. We find ourselves in a unique situation where an economic recession next year seems all but inevitable. Pick your recession indicator and it’s likely flashing the warning sign that we’re headed in that direction imminently. But what is a recession really and how does it relate to the risk of losing value in our investment portfolio?
What is a Recession?
Recessions are colloquially believed to occur when we have two calendar quarters of negative economic growth. The measure used to determine economic growth is the rate of change in our economy’s real Gross Domestic Product (“GDP”). Real GDP is a broad measure of the value of goods and services that are produced in our economy after adjusting for the effects of inflation. Officially though recessions are determined in retrospect by the National Bureau of Economic Research (“NBER”) and lack a clearly defined set of criteria that are used to indicate a recession. Instead, the NBER uses a combination of economic data in determining when a recession starts and ends. The intent is to track the peaks and troughs of business cycles.
There have been 11 official recessions in the U.S. over the past 75 years or about one every 7 years on average. Our last recession was very brief, but severe and occurred in early-2020 due to precautions taken to stem the spread of COVID-19. Prior to 2020, we enjoyed nearly 11 years without a recession. That extended period of economic growth began with the conclusion of the Great Recession of 2008-09, which was one of the worst U.S. recessions on record.
U.S. Treasury Yield Curve
Since recessions are only identified in hindsight, economists have sought to isolate certain data or data trends that have fairly reliably predicted past recessions. The market historians at The Leuthold Group have tracked 7 of these recession indicators and note that all 7 are now presaging a recession1. Perhaps the most ubiquitous of them is a measure of the U.S. Treasury yield curve.
Subtracting the current yield on 3-month U.S. Treasury bonds from the current yield on 10-year U.S. Treasury bonds is a commonly used measure of the U.S. Treasury yield curve. If the yield on very short-term bonds is higher than the yield on longer-term bonds, you get an inverted curve, which can indicate that a recession is looming.
Chart 1
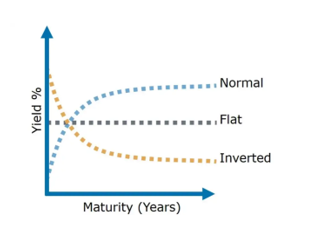
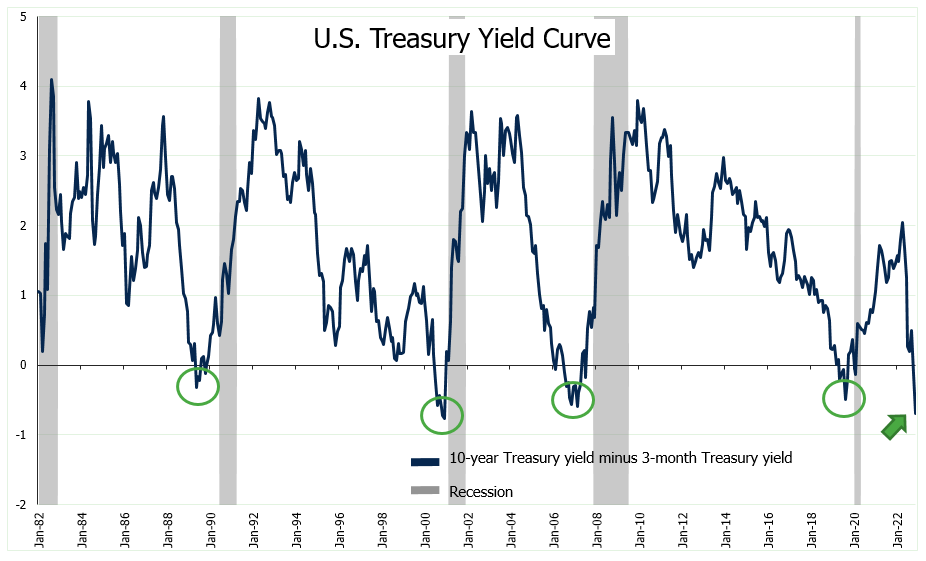
The graph above illustrates the three broad forms of the yield curve. A normal curve occurs when you receive a higher yield on longer-term bonds and a lower yield on shorter-term bonds. This relationship is reversed during an inverted yield curve. As depicted in the graph below, the yield curve has inverted prior to each of the past 4 recessions. In fact, an inverted yield curve has occurred prior to every recession since the 1960’s.
Chart 2
Other Recession Indicators
As mentioned earlier, the inverted yield curve is only one indicator that a recession is likely to occur in the near future. All the indicators tracked by The Leuthold Group are calling for a recession. Similarly, ClearBridge Investments has identified 12 indicators that it believes contribute to an accurate prediction of a recession2. In November, 8 of the indicators were predicting recession, 2 were flashing caution and 2 were still projecting further economic growth. The evidence is certainly stacked in favor of economic recession next year, but what does that mean for the capital markets in the year ahead.
A Look At The Year Ahead
While our investment philosophy doesn’t depend on predicting the direction of the capital markets over the next 12 months, we can provide some historical references to put the year ahead in some context. Schroders analyzed every recession since the Great Depression and determined that the average stock market return over the course of a recession is -6.4%3. However, if you strip out the two worst recessions, the Great Depression and the Great Recession, that average turns positive at +1.8%. Schroders also found that the stock market typically reaches a bottom during the recession, but not always. This analysis is helpful in bracing for some potential volatility in the stock market in the year ahead. However, it’s hardly a guide to be used for market timing as it’s clear that stock market performance is quite varied across past recessions.
The forecast for the bond market appears more favorable. As I described in my last blog, falling bond yields lead to higher bond prices. If a recession is in the cards for 2023, it would likely coincide with generally declining bond yields. In such a scenario, we would expect that investors will look for the Federal Reserve to pause interest rate increases or perhaps begin cutting rates when faced with an imminent recession. This may cause more investors to buy bonds, particularly longer-term bonds to try to capture some of the highest yields the bond market has offered in over a decade before the Federal Reserve begins lowering rates. In fact, this has already started to happen in the bond market as some expect that the Federal Reserve will stop raising rates in early-2023. Bonds gained nearly 4%4 in November as the yield on a 10-year Treasury bond declined from 4.1% to 3.7%5.
Capital markets are continually attempting to adjust to future expectations. Currently, it seems that the markets are pricing in a mild recession in 2023, continued declines in inflation, and about 0.5% of additional interest rate increases. There is a good deal of evidence that supports these expectations. If the markets have already priced in these expectations, as we believe they have, market volatility would be likely if economic data doesn’t continue to support this outlook.
We do believe that an economic recession is likely to begin sometime next year. It may be the most widely anticipated recession as well. That anticipation could end up suppressing its negative impact on the capital markets. Again, we aren’t making investment decisions based on near-term predictions, but just believing that a recession is looming doesn’t mean that capital markets are sure to lose value if that belief became reality. The stock and bond markets appear likely to end 2022 having lost over 10% in value. That’s after having been down as much as -24% and -17% for stocks and bonds, respectively6. It’s certainly possible that the capital markets have already adjusted to the expected reality of a recession and returns over the next year may be positive despite a recession as we begin to look beyond the recession to economic recovery. We’re not making predictions, but hopefully providing some helpful context that an official recession isn’t always coincident with falling stock and bond markets.
Table 1
| Market Indices (As Of 11/30/22) | Year-to-Date | One Year |
| Dow Jones Industrial Average | -2.9% | +2.5% |
| NASDAQ Composite | -26.1% | -25.6% |
| S&P 500 Index | -13.1% | -9.2% |
| Bloomberg US Aggregate Bond Index | -12.6% | -12.8% |
| Small Cap Stock (Russell 2000 Index) | -14.9% | -13.0% |
| Non-US Stock (MSCI EAFE Index) | -14.5% | -10.1% |
We feel so fortunate to be part of your life and wish to express our gratitude for your trust, partnership, and friendship. We truly wish you, your family, neighbors, and friends a joyous holiday season filled with love, laughter, and kindness. May 2023 be a healthy and prosperous year for you.
Gratefully yours,
Steve Dixon, CFA® CSRIC®
Investment Manager
Dana Brewer, CFP®, Bridget Handke, CFP®, Damian Winther, CFP® CSRIC®, Rachel Infante, CFP® CSRIC®, Kimmie Moehring, CFP®
Sources
1 Source: Ramsey, Doug. “Not If, But When.” Research, The Leuthold Group, December 7, 2022, https://advisors.leutholdgroup.com/research/green-book/2022/12/07/not-if-but-when.23973. Retrieved December 14, 2022.
2 Source: Franklin Templeton, retrieved December 14, 2022. U.S. Economy: Anatomy of a Recession. https://www.franklintempleton.com/insights/anatomy-of-a-recession?role=fp&gclid=CjwKCAiAheacBhB8EiwAItVO283X59C6Zif61Zqc_aqkja7xvj_YgyxgLJ1q84iJ39dL98EJ0HePLRoCMMIQAvD_BwE#recession-risk.
3 Source: Schroders, retrieved December 14, 2022. How do US stocks and earnings usually perform during a recession? https://www.schroders.com/en/us/professional-investor/insights/equities/how-do-us-stocks-and-earnings-usually-perform-during-recession.
4 Source: Morningstar, retrieved December 14, 2022. November 2022 total return for the Bloomberg US Aggregate Bond Index was +3.68%. Market indexes are unmanaged, and investors cannot invest directly in indexes. However, this index is an accurate reflection of the performance of the broad U.S. bond market. All returns reflect past performance and should not be considered indicative of future results.
5 Source: Board of Governors of the Federal Reserve System (US), Market Yield on U.S. Treasury Securities at 5-Year Constant Maturity, Quoted on an Investment Basis [DGS5], retrieved from FRED, Federal Reserve Bank of St. Louis; https://fred.stlouisfed.org/series/DGS5, November 6, 2022.
6 Source: Morningstar, retrieved December 14, 2022. Stock returns cited are for the S&P 500 Index. Bond returns cited are for the Bloomberg US Aggregate Bond Index. Market indexes are unmanaged, and investors cannot invest directly in indexes. However, this index is an accurate reflection of the performance of the broad U.S. bond market. All returns reflect past performance and should not be considered indicative of future results.
Chart 1 Source: Medium, retrieved December 13, 2022. Unraveling the inverted yield curve phenomenon. https://medium.com/@timothychong/unraveling-the-inverted-yield-curve-phenomenon-5cff85f274e6.
Chart 2 Source: Federal Reserve Bank of St. Louis. 10-Year Treasury Constant Maturity Minus 3-Month Treasury Constant Maturity [T10Y3M], retrieved from FRED, Federal Reserve Bank of St. Louis; https://fred.stlouisfed.org/series/T10Y3M, December 12, 2022.
Table 1 Source: Morningstar. Market indexes are unmanaged, and investors cannot invest directly in indexes. However, these indexes are accurate reflections of the performance of the individual asset classes shown. All returns reflect past performance and should not be considered indicative of future results.
