Market Insight - November 2018
As we approach the end of the year, our sights turn to 2019 and beyond and how the future may unfold given what we know today. One of the more interesting stories in the economy has been the labor market. At 3.7 percent, we now have the lowest level of unemployment in the United States since 19691. For several months, we’ve quipped that anyone that wants a job can find one. Of course that isn’t really true and there remains a reasonably large contingent that is underemployed based on their qualifications. Still, that statement is about as close to the truth as we may get.
Unemployment in the United States in the Last Decade
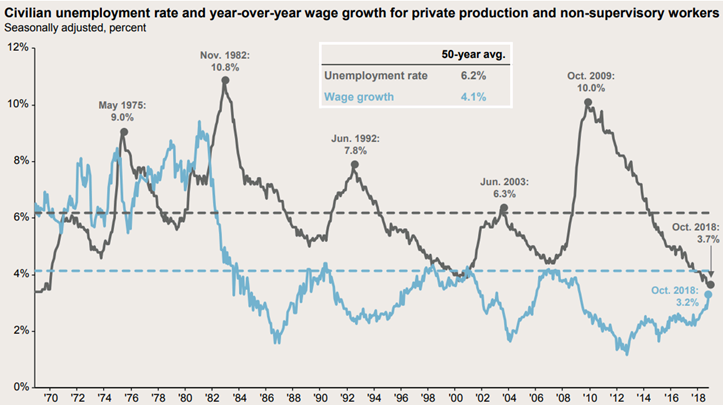
As time goes on and employers find it more difficult to find qualified workers that aren’t already employed, there is likely to be pressure to offer higher wages. This wage growth factor has been largely absent over the last decade as the unemployed have found jobs, but haven’t seen their wages grow meaningfully. In Chart 1, the black line represents the unemployment rate in the United States. Prior recessionary periods are evidenced by peaks in this line. Following a recession, the unemployment rate has tended to fall gradually until the next recessionary period. The blue line in Chart 1 represents the annual rate at which wages have increased. Until very recently, the growth in wages has been well below average during the current economic recovery. So while more and more unemployed individuals found jobs, the income they earned from those jobs increased at a fairly tepid pace.
Chart 1

Humans have a tendency to seek patterns as a means to understand complex issues and build in shortcuts in our reasoning. Sometimes, we do this to a fault. In a recent review of my 8-year-old’s math homework, I was initially concerned when I saw he answered that the difference between 88 and 44 was 132. I quickly realized that this subtraction problem was surrounded by nine other addition problems. He saw a pattern and made a shortcut in his calculations. It was an easy mistake to make when the only thing between an active boy and a knee hockey game in the basement was his math homework. Sometimes, and maybe even most of the time, there are in fact patterns. Even little Alec would probably recognize a pattern between the black and blue lines, this time rightly so, in Chart 1. He may not know what it meant, but a pattern is definitely discernable. When wages increase, production costs increase as a result, leading to lower company earnings, leading to reduced investment by companies, leading to weaker economic growth and eventually to layoffs and a possible economic recession. While wage growth doesn’t directly lead to the end of an economic growth cycle, it is difficult to argue that wages growing at about 4 percent per year hasn’t been contributive. Note that wage growth is at 3.2 percent based on the most recent data.
Since the high-inflation era of the 1970’s and early 1980’s ended, the relationship between wage growth and unemployment has been strongly inverted. The tipping point is more difficult to determine, except in hindsight. It does appear that wage growth is beginning to accelerate after languishing at around 2 percent for nearly the past decade. In isolation this may be seen as an indicator that the downward cycle of unemployment figures may be coming to an end soon. It’s never that simple though. Recent significant tax cuts need to be considered, since the timing of these cuts is quite rare at this point in the economic cycle. Trade tensions with China need to be considered as well, although the effect of higher barriers to trade with China is likely not reflected yet.
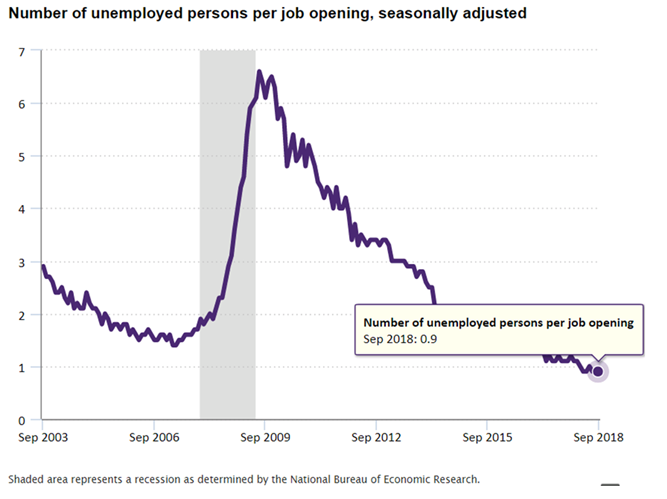
We believe a different look at the labor market reinforces the narrative of potential weakness coming. In Chart 2, we see that there are more jobs available today than there are those seeking employment. The most recent data show that there are 6.1 million unemployed people and 7.0 million job openings. While this data series only goes back to 2000, the current 0.9 unemployed people for every job opening is the lowest reading since the data series began. We believe that this data supports an argument for wage growth to continue to accelerate into 2019, thereby putting pressure on the profitability of corporations.
Chart 2

Conclusion
Our conclusion isn’t that the end of this economic cycle is at our doorstep. For those of you that read these letters often, we don’t tend to make the big, bold predictions like what you may see in the media. Our conviction is in our disciplined, diversified investment strategy, not in our ability to predict the near-term direction of markets. With that said, in some cases we have sought opportunities to be a bit more conservative in the management of investment portfolios. As you likely know, we are not prone to make dramatic changes to the design of your investment portfolio. Rather, we may hold a bit more cash in accounts that are withdrawing assets on a regular basis or we may select investments that we believe may err more toward protecting capital better in periods of market volatility for new contributions to accounts.
Despite our concerns that the labor market may have a negative effect on corporate earnings into next year, most economic data points to a relatively low near-term risk of economic recession. Data from J.P. Morgan puts the risk of recession in the next year at 32 percent2. While 32 percent may seem reasonably high, the same data from J.P. Morgan has suggested roughly a 20 to 30 percent probability of recession for the past two years.
Another fairly reliable recession indicator has been the level of short-term and long-term interest rates. While this indicator suggests an elevated risk of recession, there is little sign that one is imminent.
We review data like what we’ve presented in this letter on an ongoing basis. Our intent is to have an understanding for the current market environment and determine whether it may alter our expectations for certain investments over the next 5 to 10 years. We do not attempt to time the markets and believe those that do will be challenged to do so accurately with any consistency. There are adjustments or tilts that we may implement in your investment portfolio based on our understanding of the current market environment, but these are not intended to completely circumvent a market downturn or fully capture a rapidly ascending market. We believe in market cycles, but not in the ability to accurately predict their longevity. Therefore, our investment approach seeks to take advantage of cycles by selling from assets that appreciate in value to buy assets that have depreciated in value, but still present attractive long-term return prospects. We welcome the opportunity to discuss our investment philosophy with you in greater detail at your request.
Table 1

As Thanksgiving approaches we are all reminded of the many blessings in our lives. For me, I am thankful in so many ways that I would need another letter altogether to reflect on them. I realize in this letter I am mostly addressing clients of Birchwood, many of whom have lived on this earth longer than I and are a great deal wiser than I am. Nevertheless, I want to take the opportunity to convey a message of unity and compassion this holiday season. The difference in ideals and thought among Americans and around the world seems to have been growing rather unsustainably in recent years. In many forms of media we are inundated with messages of division, hostility and disagreement which have fostered more and more polarization. Among the many blessings in my life is, in my opinion, a well-grounded, respectful, supportive and honest group of friends and family. I hope that we are all blessed this holiday season to be surrounded by those that choose to replace intransigence with compromise and apathy with empathy, and that we share our appreciation for those that mean so much to us.
Gratefully yours,
Steve Dixon, CFA®
Investment Manager
Kay Kramer, CFP®, Dana Brewer, CFP®, Bridget Handke, CFP®, Damian Winther, CFP®, Rachel Infante, CFP®, Stacey Nelson, CFP®
Download Market Insight - November 2018 (PDF)
1. Source: U.S. Bureau of Labor Statistics, Civilian Unemployment Rate [UNRATE], retrieved from FRED, Federal Reserve Bank of St. Louis; https://fred.stlouisfed.org/series/UNRATE, November 9, 2018.
2. Source: Feroli, Michael and Silver, Daniel. “US Weekly Prospects”. J.P. Morgan. Recession probability cited is calculated by J.P. Morgan using a variety of economic data. The probability cited is the Composite from near and medium-term indicators as of November 9, 2018.
Chart 1 Source: Source: Bureau of Labor Statistics, FactSet, J.P. Morgan Asset Management, Guide to the Markets – U.S., Data are as of October 31, 2018.
Chart 2 Source: Bureau of Labor Statistics, U.S. Department of Labor, The Economics Daily, Less than one unemployed person per job opening in September 2018 on the Internet at https://www.bls.gov/opub/ted/2018/less-than-one-unemployed-person-per-job-opening-in-september-2018.htm (visited November 09, 2018).
Table 1 Source: Morningstar. Market indexes are unmanaged and investors cannot invest directly in indexes. However, these indexes are accurate reflections of the performance of the individual asset classes shown. All returns reflect past performance and should not be considered indicative of future results.


