


Market Insight Online Call Series - June 10, 2020
Thank you for joining us for our first in a series of Market Insight online calls. In this week's call I focused on why the economy is not the same as the stock market.
current state of the economy
It’s no surprise that we’re currently in a middle of a recession. Economic activity for the first quarter of 2020 was down 5 percent1, and as we look back, February was when we peaked.
Unemployment had a little bit of a rebound in May, but we hit nearly 15 percent2 in April. Chart 1 below shows just how incredible that number is. Going back to 1945, we haven’t come close to that number. Today, we still stand at about 13 percent2 unemployment, which is an improvement, but still represents a massive number of people out of work.
Chart 1
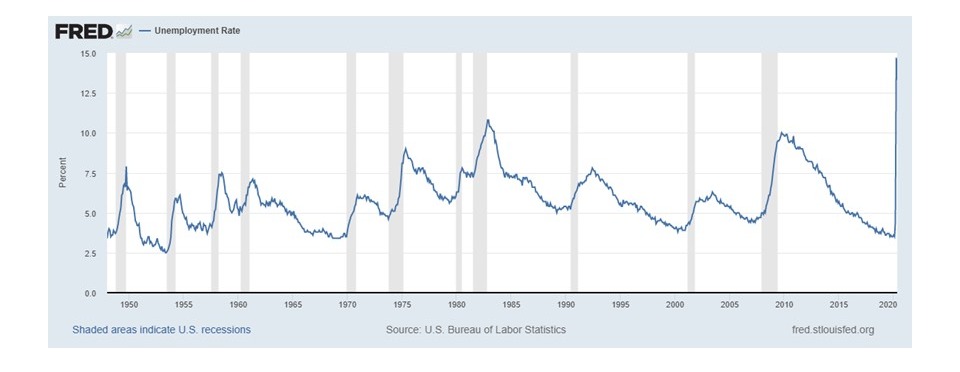
When we calculate economic activity in the U.S. we always do it for the prior quarter. For the second quarter in 2020, which will end at the end of June, many economists are projecting a 40 percent drop in GDP or economic activity in the U.S. These numbers just don’t seem real, but they are the reality.
Massive federal stimulus and support
In the midst of COVID-19, we’ve seen our largest support packages by congress and the Federal Reserve in the form of the CARES Act, which was about 2 trillion dollars with 600 billion of that as payments to individuals. This 2 trillion dollars is about 2 plus times the amount that was spent in the 2008 financial crisis.
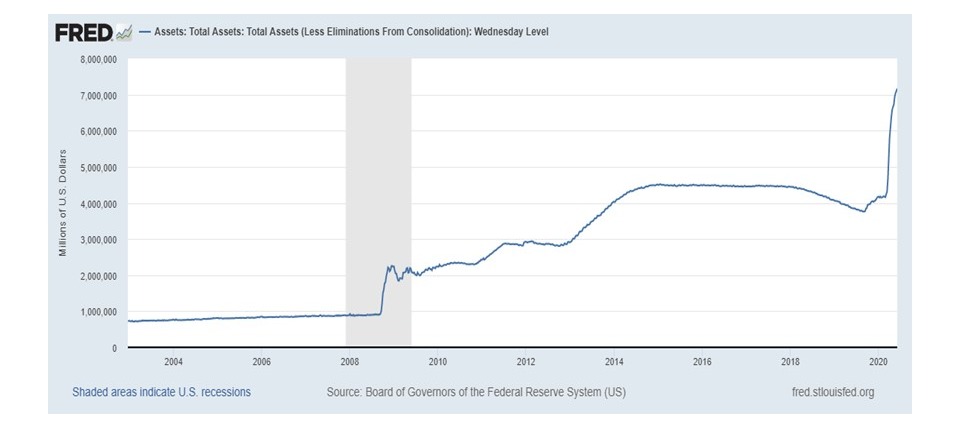
Chart 2 shows the value of the assets that the Federal Reserve holds. As you can see the little blip back in 2008, which at the time seemed really big, is when they started buying assets. Fast forward to this year, and you can see the increase in the buying activity as compared to 2008. Other actions include a cut to the short-term interest rate to basically zero, which helps encourage spending and discourage savings.
Chart 2
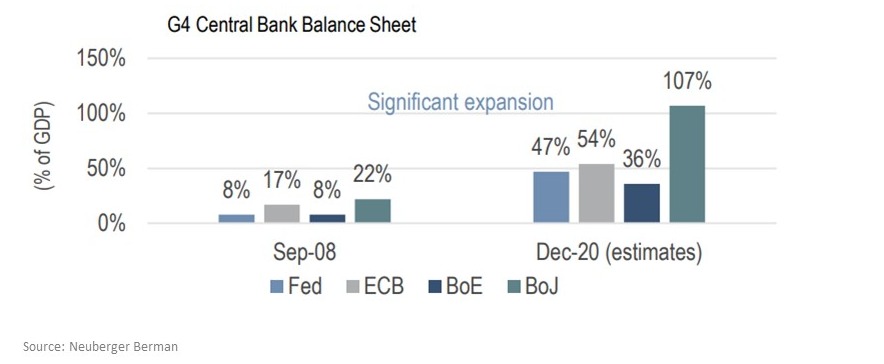
In Chart 3, you can see that it's not just the US that’s active. It’s global and synchronized.
Chart 3
Stock market looks forward
The stock market is looking forward and based on all that stimulus, which is very supportive of the stock market, you are also starting to see signs that we’re heading towards a direction of getting back towards normal.
- Last week’s employment report shows that we gained 2.5 million jobs3. The last estimate was for a loss of over 7 million jobs.
- Auto sales in May rebounded 40 percent4.
- In May mortgage applications rebounded 60 percent4.
- Stay-at-home orders are lifting in various locations across the world
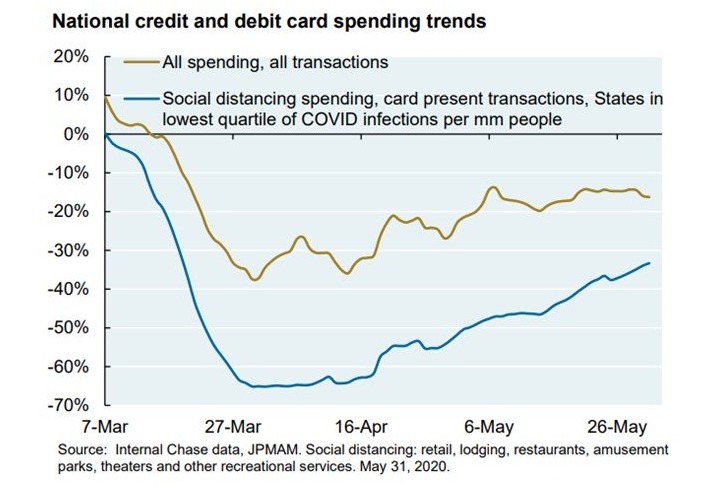
In Chart 4, the blue line represents credit card transactions where cards are present at use, like at a store or restaurant. This blue line is a sign that people are out and about and spending money more than they were two months ago. Again another sign that we might be headed towards a direction of getting back to normal.
Chart 4
In the US, we are estimated to see a 6 percent5 drop in economic activity when we're all said and done for the year. Looking forward to 2021, based on the stimulus we’ve put into the economy, and the anticipation of a vaccine or treatment that allows us to move back to regular day-today lives, the expectation for growth and activity next year is almost 5 percent5, which is a big number for such a large economy.
The Federal Reserve has lowered interest rates to almost zero, which is where we were at the beginning of the last decade. You can therefore invest in cash that yields next to nothing, or you can invest in a treasury bond which yields about 0.7 percent per year, or you can take some risk and buy stocks or lower quality bonds and try to increase your return. The market is finding stocks attractive because safe assets are unattractive.
Pitfalls of market timing
Chart 5 is a telling chart that shows how difficult it is to time markets. It shows that if you missed the best 5 days over the last 20 years, it cost you about $100,000 over time due to compounding. Timing is difficult to do and can be costly if you are not accurate.
Chart 5
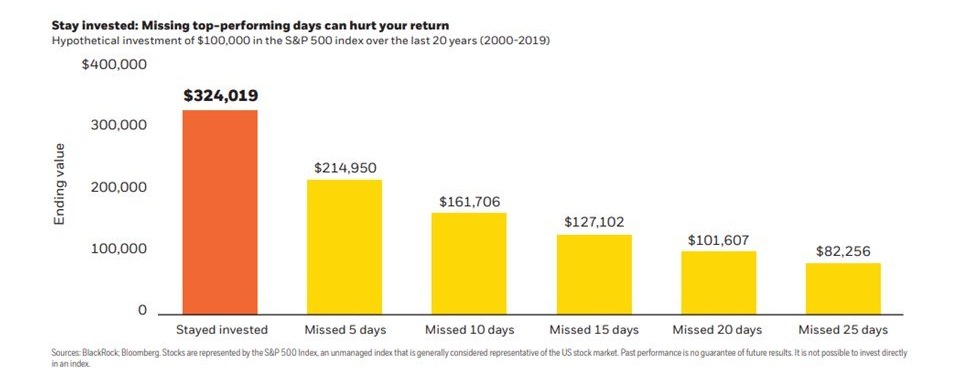
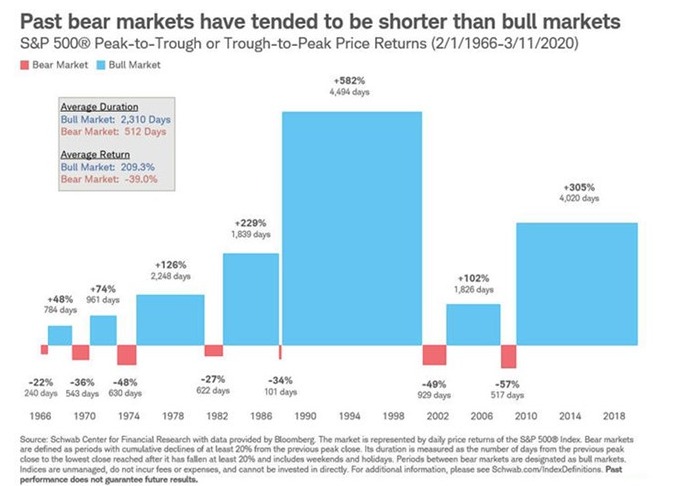
Chart 6 is a reminder, bear markets can be terrible and trigger emotions in us that make us want to hide or protect. As you see below the red bars represent bear markets and the blue bars the bull markets. Bull markets have tended to last longer and to grow more while bear markets have tended to last relatively short periods of time. We believe, even during a bear market, in sticking with a strategy of having a diversified portfolio, which includes staying invested in the market even during bad times.
Chart 6
At Birchwood, we're concentrating on investing for the long term. We still believe we will come out of this at some point and move back to normal, albeit a different normal. We balance portfolios based on discipline not based on when we think the market is peaking or bottoming, which can be incredibility difficult to do.
Download Slides (PDF)
Register now |
Long-Term Consequences of Government Stimulus |
| Wednesday, June 24th at 12:00 p.m. |
 |
Sources
1 Source: U.S. Bureau of Economic Analysis. https://www.bea.gov/data/gdp/gross-domestic-product. accessed June 10, 2020.
2 Source: FRED Economic Data. https://fred.stlouisfed.org/series/UNRATE accessed June 10, 2020
3 Source: U.S. Bureau of Labor Statistics
4 Source: J.P. Morgan Eye on the Market: https://am.jpmorgan.com/content/dam/jpm-am-aem/global/en/insights/eye-on-the-market/06-08-2020%20-%20The%20bounce_AMV_NI.pdf)
5 Source: International Monetary Fund; Neuberger Berman. As of April, 2020
Chart 1 Source: FRED Economic Data. https://fred.stlouisfed.org/series/UNRATE accessed June 10, 2020
Chart 2 Source: FRED Economic Data. https://fred.stlouisfed.org/series/WALCL accessed June 10, 2020
Chart 3 Source: Nueberger Berman
Chart 4 Source: Internal Chase data, JPMAM. Social distancing: retail, lodging, restaurants, amusement parks, theaters and other recreational services. May 21, 2020
Chart 5 Source: BlackRock; Bloomberg
Chart 6 Source: Schwab Center for Financial Research with data provided by Bloomberg
